
Most call center managers aren't short on data. They're short on confidence in what the data means.
A typical week looks like this. The dashboard shows handle times, queue lengths, staffing gaps, survey results, transfer counts, and agent activity logs. Yet underlying questions stay unresolved. Are customers getting their issue solved? Are long calls a problem, or are they the result of agents doing the right thing? Is speed improving service, or just pushing repeat contacts into tomorrow's queue?
That tension is why call center key performance indicators matter. Not as a giant list, but as a disciplined scorecard. The right KPIs tell you whether your operation is easier for customers to use, easier for agents to run, and cheaper to support without hollowing out quality. The wrong KPIs create motion without progress.
In practice, strong KPI programs separate activity metrics from outcome metrics. Activity metrics tell you what happened inside the center. Outcome metrics tell you whether the customer left with less effort, more clarity, and no reason to come back for the same issue.
Moving Beyond Data Overload
A lot of teams still manage the call center by counting work instead of judging results. That approach feels rigorous because the spreadsheet is full. It usually isn't.
A manager can watch call volume rise, average handle time fall, and occupancy stay high, then still miss the bigger problem. Customers may be getting rushed, transferred, or forced into repeat contacts because agents are optimizing for the wrong target. That's how centers hit internal goals while creating external frustration.
What vanity metrics miss
Vanity metrics aren't useless. They just become dangerous when they lead the conversation.
Examples include:
- Raw call volume: Helpful for staffing, but it doesn't tell you whether contacts were necessary.
- Low handle time in isolation: It can signal efficiency, or it can signal shallow resolution.
- High agent busyness: A full queue may look productive while masking burnout and poor routing.
The better question is simpler. Which measures predict whether the customer got what they needed with minimal friction?
Practical rule: If a KPI can't help you make a staffing, coaching, routing, or process decision, it probably belongs lower on the dashboard.
Independent research highlighted in Indeed's summary of McKinsey's analysis of over 100,000 customer journeys found that reducing customer effort was associated with lower disloyalty, which is why leaders should prioritize KPIs tied to resolution quality and friction reduction, not speed alone (Indeed on call center KPIs).
A smaller KPI set usually works better
Most centers perform better when they anchor reporting around a compact operating set. That means a few core measures, each with a clear owner and a clear action when performance slips.
A practical scorecard usually asks:
- Can customers reach us fast enough?
- Can agents solve the issue in the first interaction?
- Did the customer leave satisfied?
- Are we delivering that outcome efficiently?
That logic matters even more when support expands beyond voice into chat and video. A medical practice handling patient support by secure video, for example, may accept a longer interaction if the issue gets resolved cleanly and the patient avoids another call. Teams that host remote support sessions also need channel-specific operating habits, which is why good virtual meeting practices now influence contact center performance more than many managers expect.
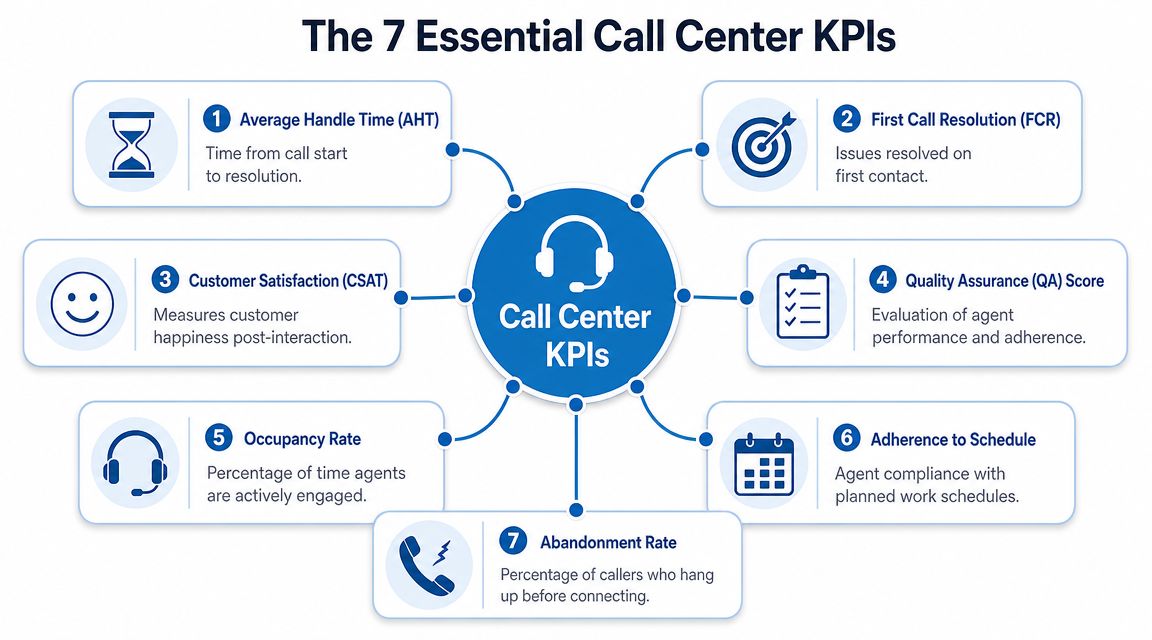
The 7 Essential Call Center KPIs Explained
Most KPI stacks become clearer when you stop treating every metric as equal. A few belong on the main screen. Everything else supports diagnosis.
CallMiner's guidance is useful here. It frames a rigorous KPI stack around a handful of formulas, with FCR measuring first-contact problem-solving and AHT combining talk time, hold time, and after-call work. It also notes that improving FCR typically lowers repeat-call volume, which helps both customer experience and cost per contact (CallMiner on important call center KPIs).
The core measures that deserve daily attention
| KPI | Formula | Industry Benchmark |
|---|---|---|
| Average Handle Time (AHT) | Total talk time + total hold time + total after-call work, divided by total handled contacts | No universal benchmark. Track by queue and issue type |
| First Call Resolution (FCR) | Issues resolved on first contact divided by total issues or contacts measured | No universal benchmark. Higher is better if quality holds |
| Average Speed of Answer (ASA) | Total waiting time divided by number of inquiries answered | No universal benchmark. Lower is better when matched to staffing reality |
| Customer Satisfaction (CSAT) | Post-interaction satisfaction responses divided by total survey responses, based on your survey method | No universal benchmark. Trend and verbatim feedback matter most |
| Net Promoter Score (NPS) | Promoters minus detractors, based on your survey method | No universal benchmark. Use as a trend measure, not an agent score |
| Occupancy | Time agents spend handling work divided by available staffed time | No universal benchmark. Use with burnout and schedule context |
| Shrinkage | Paid time not available for handling contacts because of meetings, coaching, leave, training, or other non-queue work | No universal benchmark. Forecast it rather than treat it as failure |
What each KPI tells you
Average Handle Time
AHT is the full work time tied to a contact, not just the conversation. It includes talk time, hold time, and after-call work.
It matters because it exposes process friction. If AHT rises after a system change, agents may be searching for answers, documenting too much manually, or handling more complex cases. A lower AHT is good only when FCR and CSAT stay healthy.
Practical example: a billing team shortens calls by skipping recap steps. AHT improves, but callbacks rise because customers still don't understand the final charge. That's not efficiency. It's deferred work.
First Call Resolution
FCR measures whether the customer's issue was solved on the first interaction. This is one of the strongest operational indicators of whether the center is doing meaningful work.
If FCR is weak, agents may lack authority, the knowledge base may be thin, or routing may be sending the wrong work to the wrong queue. In communities and social support channels, this same logic applies, which is why resources on CSAT for community managers can be useful when your support operation spans more than voice.
A short call that creates a second call is usually more expensive than a longer call that closes the issue.
Average Speed of Answer
ASA tells you how fast customers reach a person after entering the queue. This is a responsiveness metric, not a quality metric.
Use it to spot staffing and routing strain. If ASA spikes at the same time abandonment rises, access is breaking down before the service conversation even begins.
Customer Satisfaction
CSAT captures post-interaction satisfaction. It doesn't tell you everything, but it tells you whether the customer felt the experience worked.
Keep survey windows close to the interaction. Read comments, not just scores. A low-volume queue with rich verbatim feedback often gives better coaching insight than a larger queue with shallow surveys.
The support KPIs that complete the picture
Net Promoter Score
NPS is broader than transaction-level satisfaction. It reflects loyalty and advocacy, so it works better as a trendline for teams, programs, or channels than as a judgment on one agent's shift.
Use it to ask a strategic question. Are customers merely getting through, or are they building trust in the service experience?
Occupancy
Occupancy shows how much of staffed time agents spend actively engaged. It's useful, but easy to misuse.
Very high occupancy can look efficient while creating fatigue, rushed wrap-up work, and weaker empathy. Very low occupancy can signal overstaffing or poor forecasting. Review it with schedule design, not in isolation.
Shrinkage
Shrinkage is the gap between paid time and queue-available time. Training, coaching, breaks, compliance reviews, and meetings all sit here.
Good managers don't try to eliminate shrinkage. They plan for it. If you don't reserve time for training and QA, the queue may look efficient today while service quality decays next month.
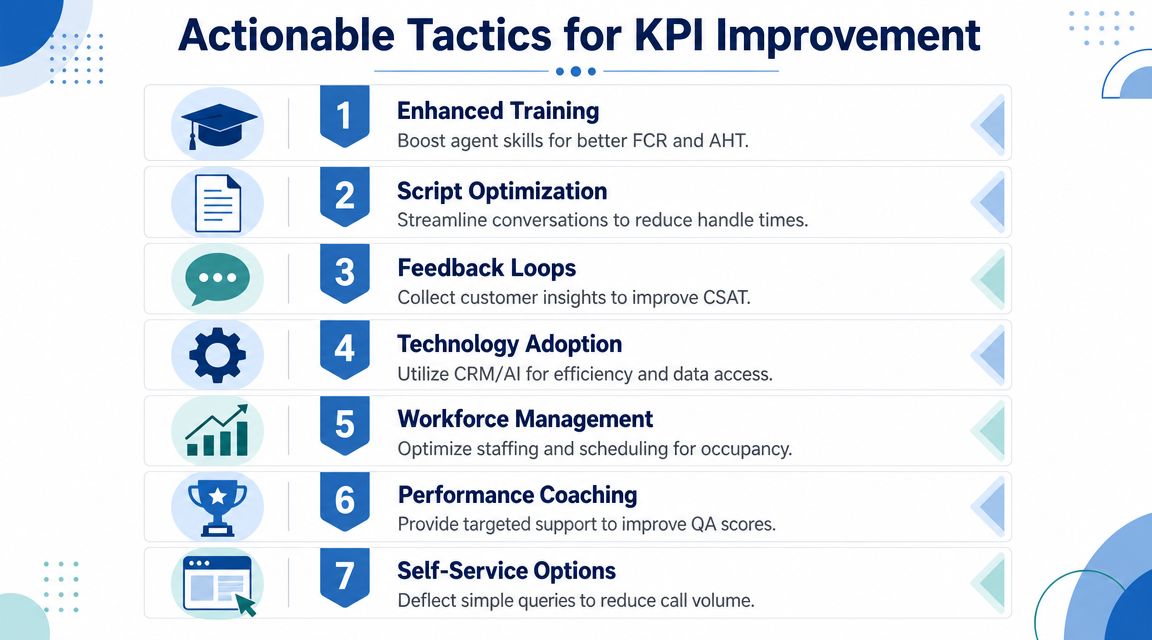
Actionable Tactics to Improve Each Key Metric
Once the scorecard is set, the work gets more practical. Every KPI should have a short list of interventions you can run, test, and coach against.
Genesys notes that abandonment rate reflects customers who disconnect before reaching an agent, and defines ASA as total waiting time divided by the number of inquiries. It also highlights an important relationship cited by UCFS: a 1% improvement in FCR can lead to a 1% improvement in customer satisfaction (Genesys on call center metrics and KPIs). That link is why resolution tactics usually outperform speed-only tactics.
Tactics that improve resolution and quality
Raise FCR by changing agent authority
Many centers try to improve FCR with more scripts. The better fix is often better decision rights.
Give trained agents clear approval boundaries for common exceptions, replacements, credits, appointment changes, or account corrections. When every edge case requires escalation, FCR drops even if agents are polite and fast.
Use this quick checklist:
- Map repeat contacts: Pull a weekly sample of customers who recontacted for the same issue.
- Tag avoidable escalations: Separate policy blocks from training blocks.
- Expand authority carefully: Let agents resolve the top recurring issues without supervisor intervention where appropriate.
Improve CSAT through tighter feedback loops
Surveying customers isn't enough. Managers need to connect survey comments to coaching behavior.
A practical loop looks like this:
- Review low-score comments by issue type, not by agent alone.
- Match comments to call recordings or transcripts.
- Coach one behavior at a time, such as recap clarity, transfer ownership, or expectation setting.
- Recheck results over the next review cycle.
If you're looking for a broader operational playbook, this guide on unlocking peak contact center performance is a useful companion to internal QA reviews.
When CSAT falls, don't start with tone. Start with whether the customer got a clear answer, a clean next step, and a believable timeline.
Tactics that improve speed without breaking quality
Lower AHT by fixing workflow, not by rushing agents
The most effective AHT improvements usually happen outside the call.
Good examples:
- Pre-fill records: Reduce manual lookup before the conversation starts.
- Standardize disposition codes: Agents lose time when wrap-up choices are messy.
- Use guided call flows: Not robotic scripts, but structured prompts for common issues.
- Cut audio friction: Background echo and poor microphone setup add repetition and confusion, so teams running remote support should train agents on basics like stopping mic echo.
A practical example from video-based support: if an agent can show a patient or customer where to click, hold up a document, or visually verify a serial number, the interaction may take longer on paper but eliminate the second contact entirely. That's a favorable trade in many queues.
Reduce ASA and abandonment with queue design
Customers abandon when they don't believe waiting will pay off. Managers often focus only on adding headcount. Better queue design helps too.
Try these moves:
- Separate simple from complex contacts: Don't let password resets sit behind escalated technical calls.
- Offer callback paths: This lowers queue anxiety even when staffing is tight.
- Tune intraday staffing: Breaks, coaching, and meetings should avoid known pressure windows.
- Review blocked and abandoned contacts together: If customers never reach an agent, the service level problem starts before agent performance does.
Tactics for occupancy and shrinkage
Use occupancy as a planning signal
If occupancy stays high for long stretches, quality usually starts leaking through wrap-up shortcuts, weaker listening, and more transfers. The answer isn't "work harder." It's redesigning schedules, back-office load, and channel mix.
Treat shrinkage as planned investment
Schedule coaching, training, calibration, and compliance reviews deliberately. Don't squeeze them into leftover time. Teams that do this consistently tend to make steadier KPI gains because the operation isn't starving its own capability.
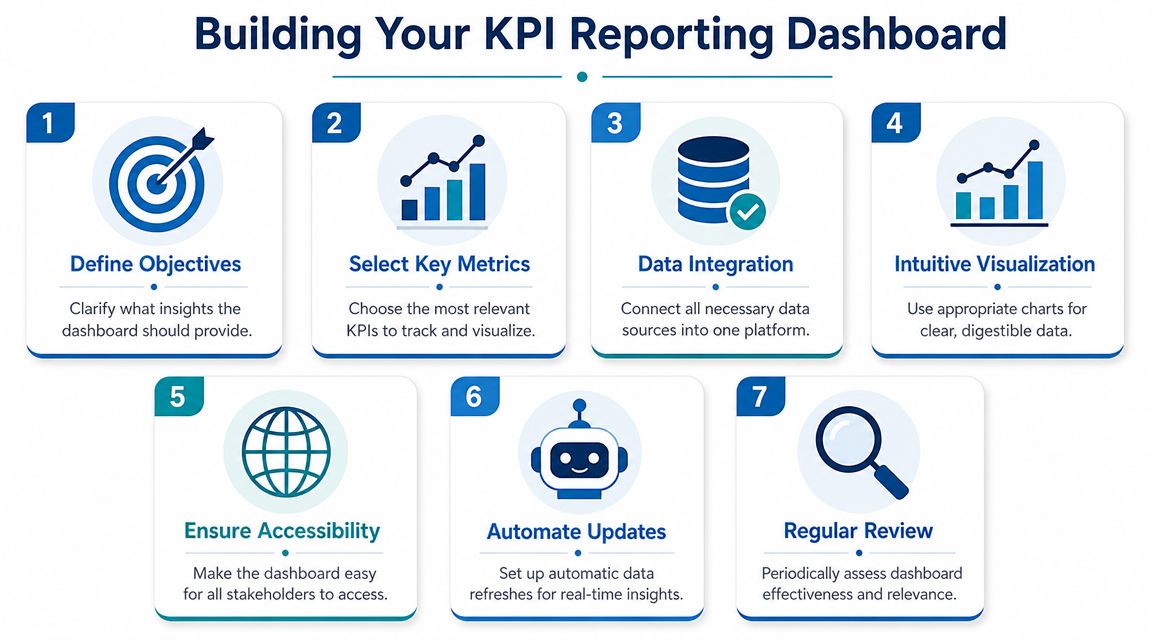
Building Your KPI Reporting Dashboard
A dashboard should answer three questions quickly. What needs attention now, what trend is changing, and who needs help.
If it can't do that, it's a report archive, not an operating tool.
What to watch by reporting cadence
A practical reporting rhythm keeps urgent measures visible without burying leaders in noise.
| Cadence | Best-fit KPIs | What managers should look for |
|---|---|---|
| Daily | ASA, abandonment, service level, queue backlog | Access problems, routing strain, staffing misses |
| Weekly | FCR, occupancy, QA patterns, transfer reasons | Process issues, training gaps, workload imbalance |
| Monthly | CSAT trends, NPS trends, shrinkage mix, channel comparison | Structural improvement, customer sentiment, planning quality |
What the dashboard should show
A useful dashboard needs:
- Trend lines: Today's number without context creates overreaction.
- Threshold colors: Red, yellow, and green help managers spot exceptions fast.
- Drill-down views: Team-level and agent-level views should sit behind the headline metric.
- Channel comparison: Voice, chat, and video should not be blended into one average if the workflows differ.
A layout that works in practice
Top row: access metrics such as service level, ASA, and abandonment.
Middle row: outcome metrics such as FCR, CSAT, and QA.
Bottom row: workforce and execution metrics such as occupancy, shrinkage, schedule adherence, and issue-category trends.
Build the dashboard for action, not admiration. If a supervisor can't tell what to do in the next hour, the screen is too busy.
One more practical point. Keep targets visible, but don't overfill the screen with benchmarks. A clean dashboard lets managers notice movement. A cluttered one turns every metric into wallpaper.
How Modern Tools and Compliance Shape Your KPIs
Contact centers no longer live on voice alone. Support now happens across phone, chat, screen share, and video. That changes both what good service looks like and how managers should read performance.

Centrical's guidance still holds as the operational baseline. It centers performance on AHT, FCR, CSAT, and service level, and gives a common service-level benchmark of answering 80% of calls within 20 seconds (Centrical on contact center KPIs). But in modern support environments, those measures need channel context.
Video support changes the trade-offs
Video often raises handle time. That's not automatically a problem.
If a support rep can visually confirm an insurance card, walk a patient through pre-visit steps, help a customer assemble equipment, or review a form on screen, the interaction may take longer while producing a cleaner resolution. In those cases, managers should judge the channel on resolution quality, repeat contact avoidance, and customer confidence, not on voice-era speed targets alone.
The same applies to webinars and group education. A support organization that runs onboarding sessions, patient prep briefings, or recurring training may reduce repetitive one-to-one contacts later. That value rarely shows up if you only stare at AHT.
Compliance should be measured, not treated as background
In regulated environments, quality isn't just courtesy and script adherence. It includes privacy behavior.
Managers in healthcare and other sensitive settings should include checks such as:
- Consent handling: Did the agent follow the approved process before discussing sensitive information?
- Recording discipline: Was the interaction handled according to policy?
- Identity verification: Did the agent verify correctly without creating unnecessary friction?
- Secure channel use: Was the right encrypted workflow used for the interaction type?
For teams needing secure video in that workflow, HIPAA-compliant video conferencing platforms become part of KPI performance because the tool affects both adherence and customer effort.
Practical tool choices without overspending
Price still matters. A small clinic, tutoring company, or support team doesn't need enterprise sprawl if their need is secure meetings, webinars, recordings, and straightforward controls. Some teams use broad enterprise suites with layered add-ons. Others choose leaner platforms that include webinar hosting, encryption, and compliance-ready features in the base plan.
One example is AONMeetings, which the publisher states starts at ₹179 per user per month, includes unlimited meeting time, webinar hosting, and bank-level encryption, and is designed for browser-based secure meetings. For a manager comparing options, that's less about brand preference and more about KPI economics. If the tool supports encrypted video support, documentation, and training without forcing separate webinar spend, it can help protect both service quality and budget discipline.
Industry-Specific KPI Adjustments
The right KPI stack changes by industry because customer risk changes by industry.
A billing support center, a telehealth intake desk, and an education help desk shouldn't chase the same hierarchy of metrics. They may track similar measures, but they shouldn't weight them the same way.
Healthcare and telemedicine
Healthcare teams usually need to prioritize resolution quality, compliance adherence, and clarity of next steps over pure speed. A patient who has to call back because medication instructions were unclear or a visit link failed doesn't experience that as a minor inconvenience.
In this setting, managers often make better decisions by:
- Prioritizing FCR for high-anxiety workflows: Scheduling, intake, billing clarification, and pre-visit support benefit from one-contact closure.
- Adding privacy behavior to QA: The interaction can feel warm and still fail if identity checks or protected-information handling are weak.
- Reading AHT carefully: A longer secure video interaction may be completely appropriate if it prevents confusion and repeat contacts.
Education and tutoring support
Education support has a different shape. Calls and video sessions often involve students, parents, instructors, and administrators, each with different expectations.
Useful adjustments include:
- Redefining satisfaction: CSAT should capture whether the learner or parent got a usable answer, not just whether the interaction felt polite.
- Tracking session readiness issues: Many support contacts come from access links, device setup, or schedule confusion.
- Using webinar-style sessions proactively: Group orientation or exam-prep briefings can reduce repetitive support questions later.
In education support, a good KPI program measures whether people can start learning with less friction, not just whether the queue moved quickly.
SMB service teams
Small businesses usually have tighter budgets and smaller benches, so they need a KPI stack that protects service without creating reporting overhead.
That often means:
- Leading with FCR, CSAT, and cost per interaction: These measures connect most directly to retention and efficiency.
- Watching channel mix: A founder-led support team may solve more in a short video call than in a long email chain.
- Using NPS as a directional signal: For smaller teams, loyalty feedback can reveal whether support is helping growth or hindering it.
The common mistake across all three industries is copying a generic dashboard. The stronger move is to match KPI priority to customer risk, regulatory exposure, and channel reality.
The Future of Call Center Metrics and AI
The next KPI debate won't be whether to automate. It will be how to judge automation fairly.
Recent industry reporting summarized by RingCentral notes a Gartner projection that by 2026, 10% of agent interactions would be automated, and that shift raises new questions about containment quality, escalation accuracy, and whether AI improves net resolution rather than merely deflecting contacts (RingCentral on call center metrics).
That matters because older call center key performance indicators were built for human-to-human voice interactions. AI changes the unit of measurement. A fast bot isn't useful if it routes customers poorly, gives shaky answers, or creates extra effort before a human ever joins.
The practical future is a blended scorecard. Keep the classic operational metrics, but add AI-specific measures such as containment quality, escalation accuracy, and automated resolution quality. Then judge all of them by one standard. Did the customer get the right outcome with less friction?
If you're reworking your KPI strategy around secure video support, compliance, and tighter budgets, AONMeetings is worth evaluating as part of the stack. It offers HIPAA-compliant video conferencing, built-in webinars, encryption, and browser-based access, which makes it relevant for healthcare teams, educators, and support groups that need modern service channels without adding unnecessary platform complexity.